Reports and Dashboards
After you run evaluations, simulations, or stream traffic through monitoring, Okareo surfaces results in the app so you can see runs, metrics, trends, and issues in one place. This page points you to where to look.
Where to Find What
| What you want | Where to look |
|---|---|
| Test runs and evaluation results | Runs (or Test Runs) — Each evaluation or simulation produces a run. Open a run to see the scenario, model/target, and per-datapoint or per-turn check results. |
| Monitoring issues and errors | Issues — Real-time monitoring writes here when a check fails or an error occurs. Use filters by monitor, time, or severity to triage. |
| All incoming datapoints | Issues (or Datapoints) — Depending on your setup, you may see all requests evaluated by a monitor, with pass/fail and links to replay. |
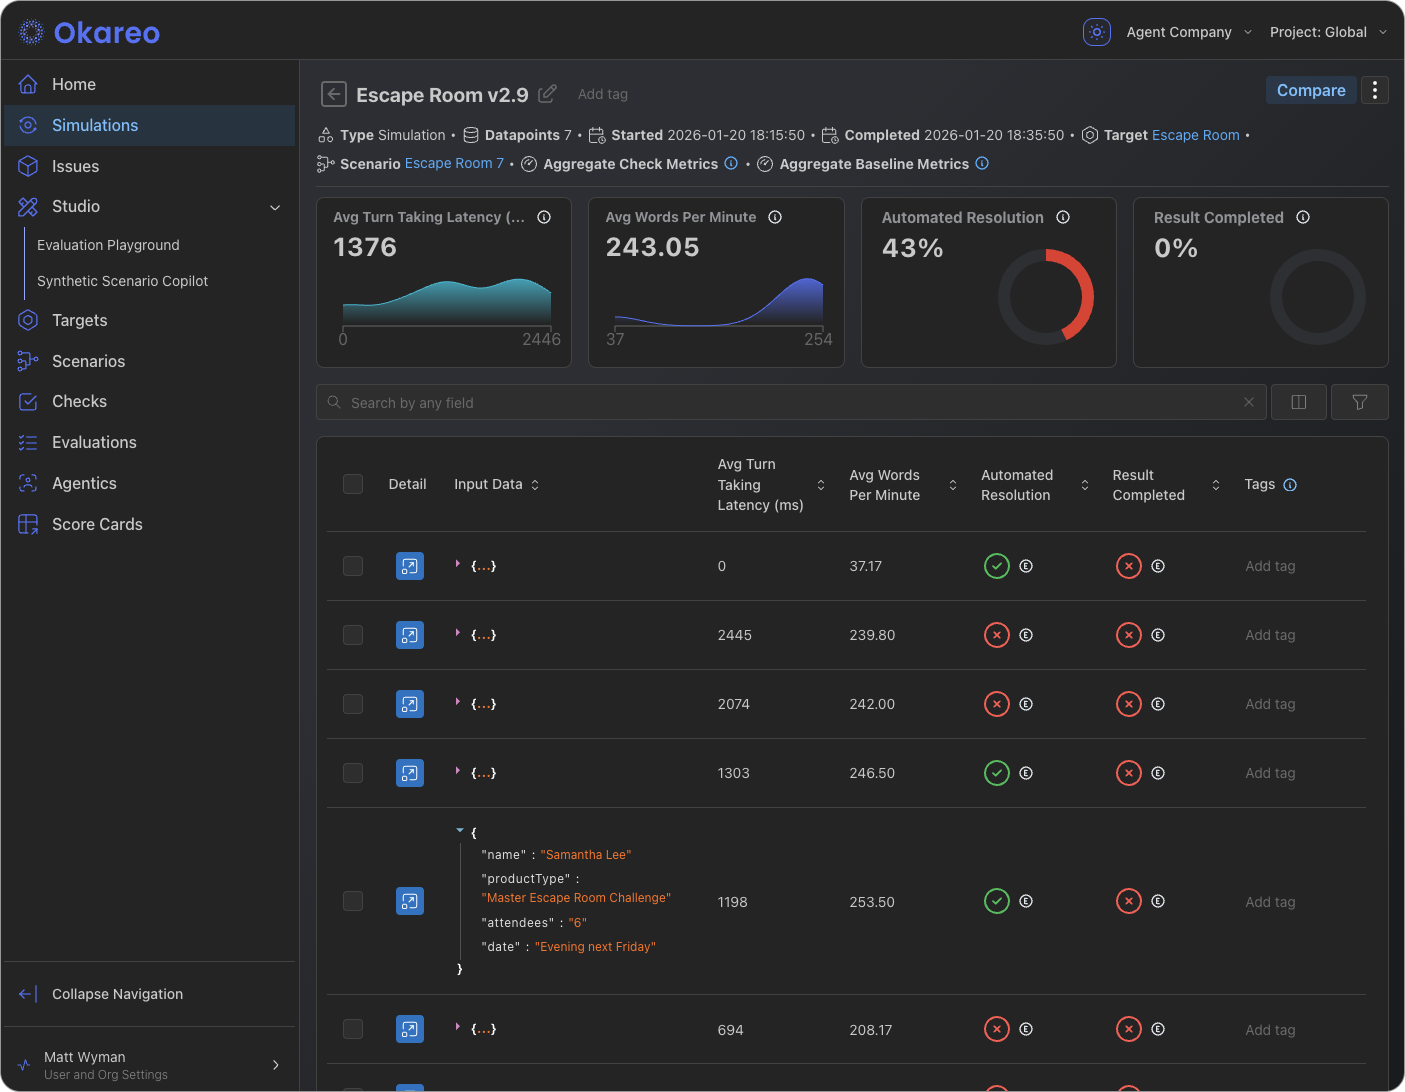
| Simulation and multi-turn results | Simulations (or Multi-Turn) — List of simulation runs; open one to see the full transcript, per-turn checks, and target/driver config. |
| Metrics over time | Run history and comparison views — Compare runs to see how checks or metrics changed between model versions or scenario sets. |
Use these views to confirm that new deployments don’t regress, to spot patterns in failures, and to share concrete examples (with replay) with your team.
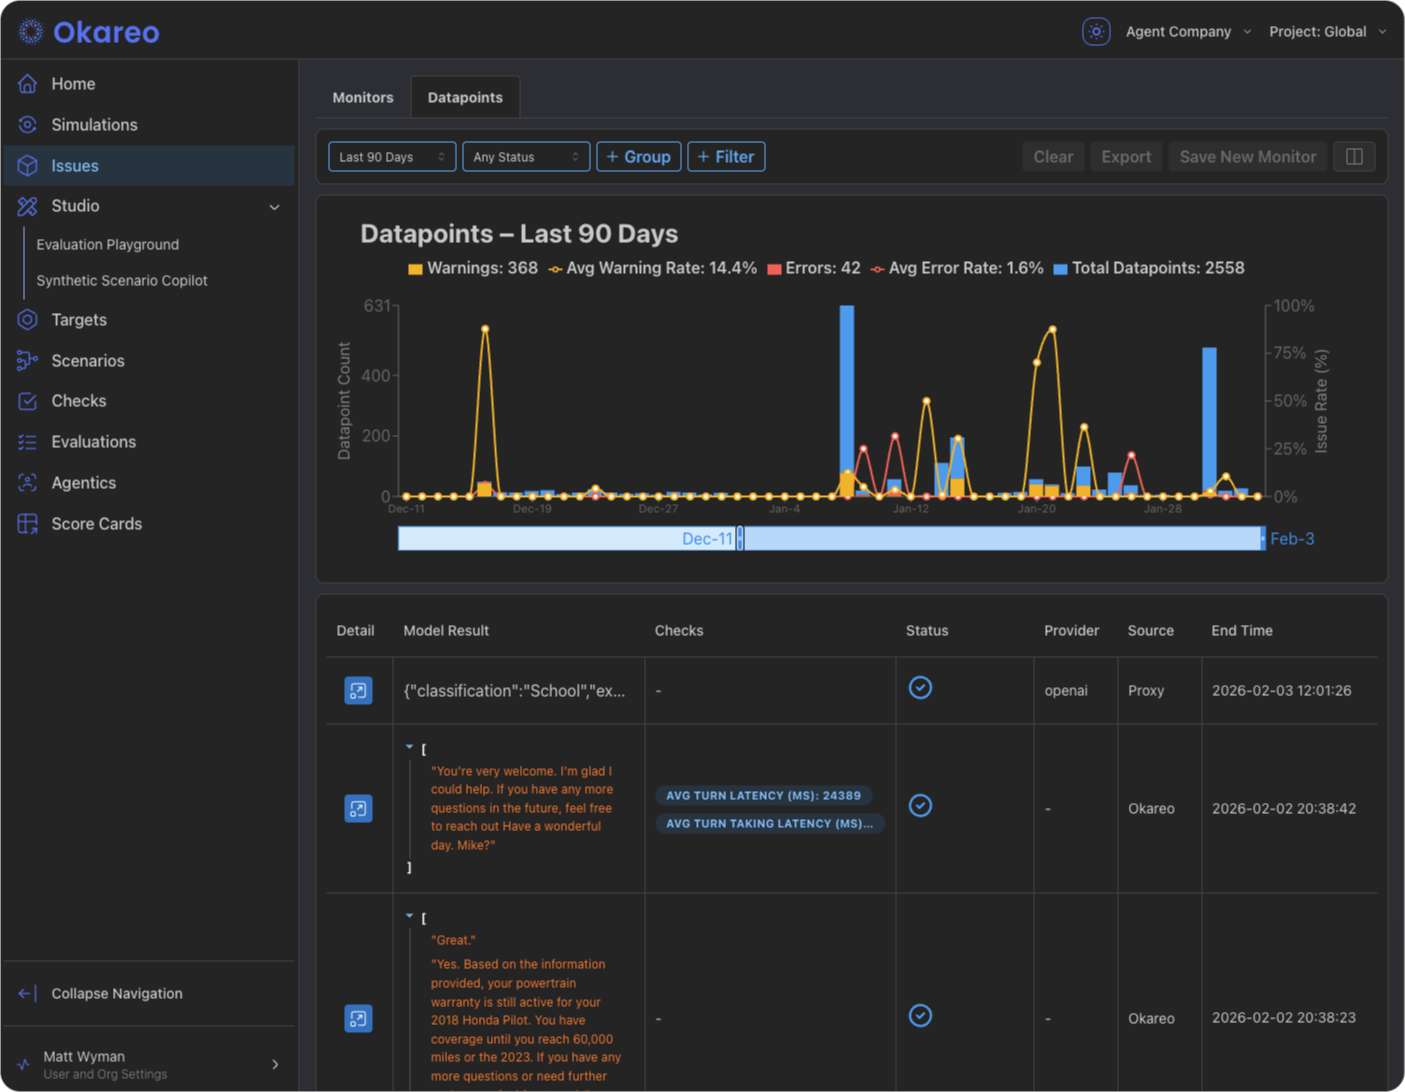
Issues
The Issues area is the main place for monitoring outcomes: every time a monitor’s checks fail or an error is recorded, an entry appears here. You can:
- Filter by monitor, time range, or severity.
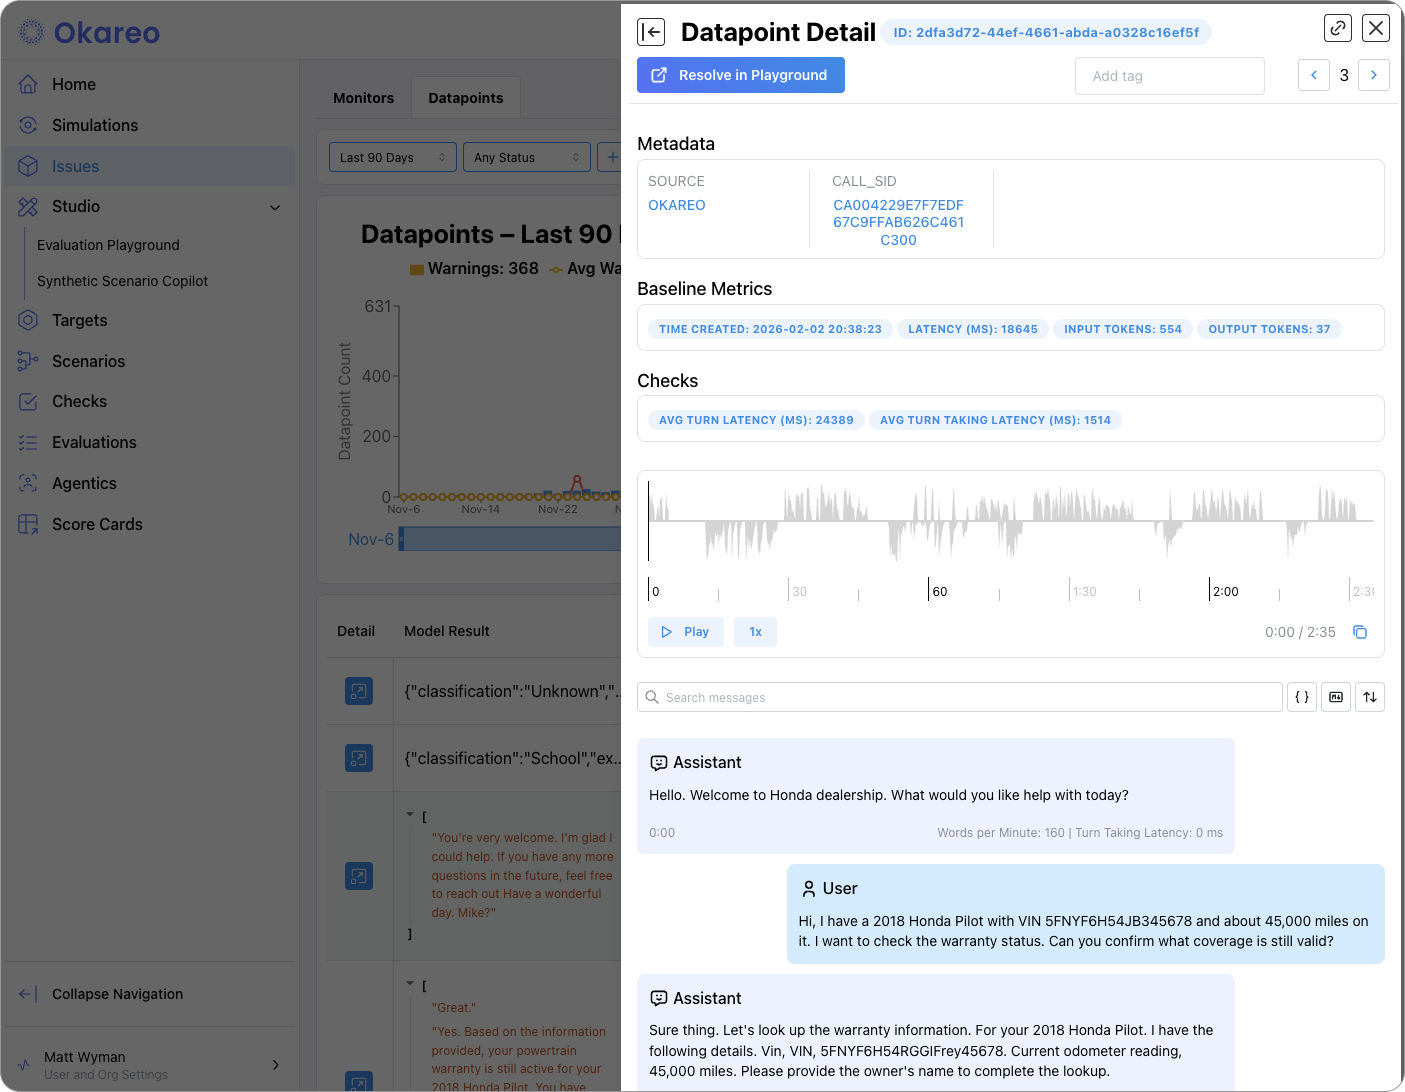
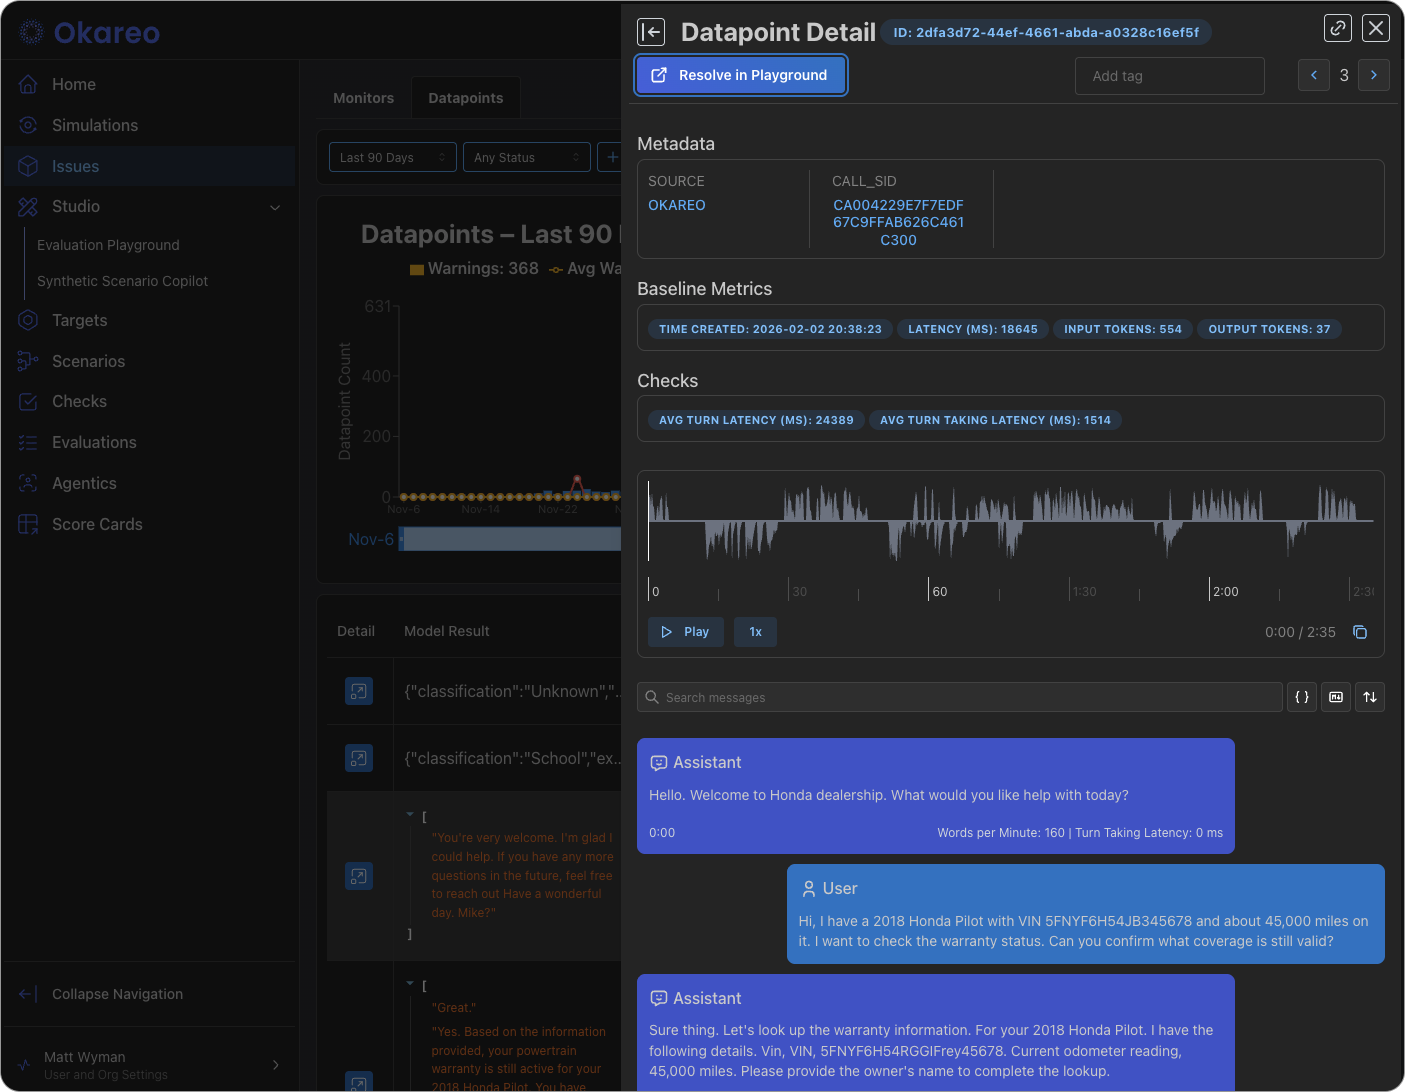
- Open an issue to see the full replay: messages, tool calls, and the exact prompt/response that triggered the alert.
- Use the replay to debug root cause (e.g. prompt drift, retrieval miss, scope violation) and then fix the agent or add a check.

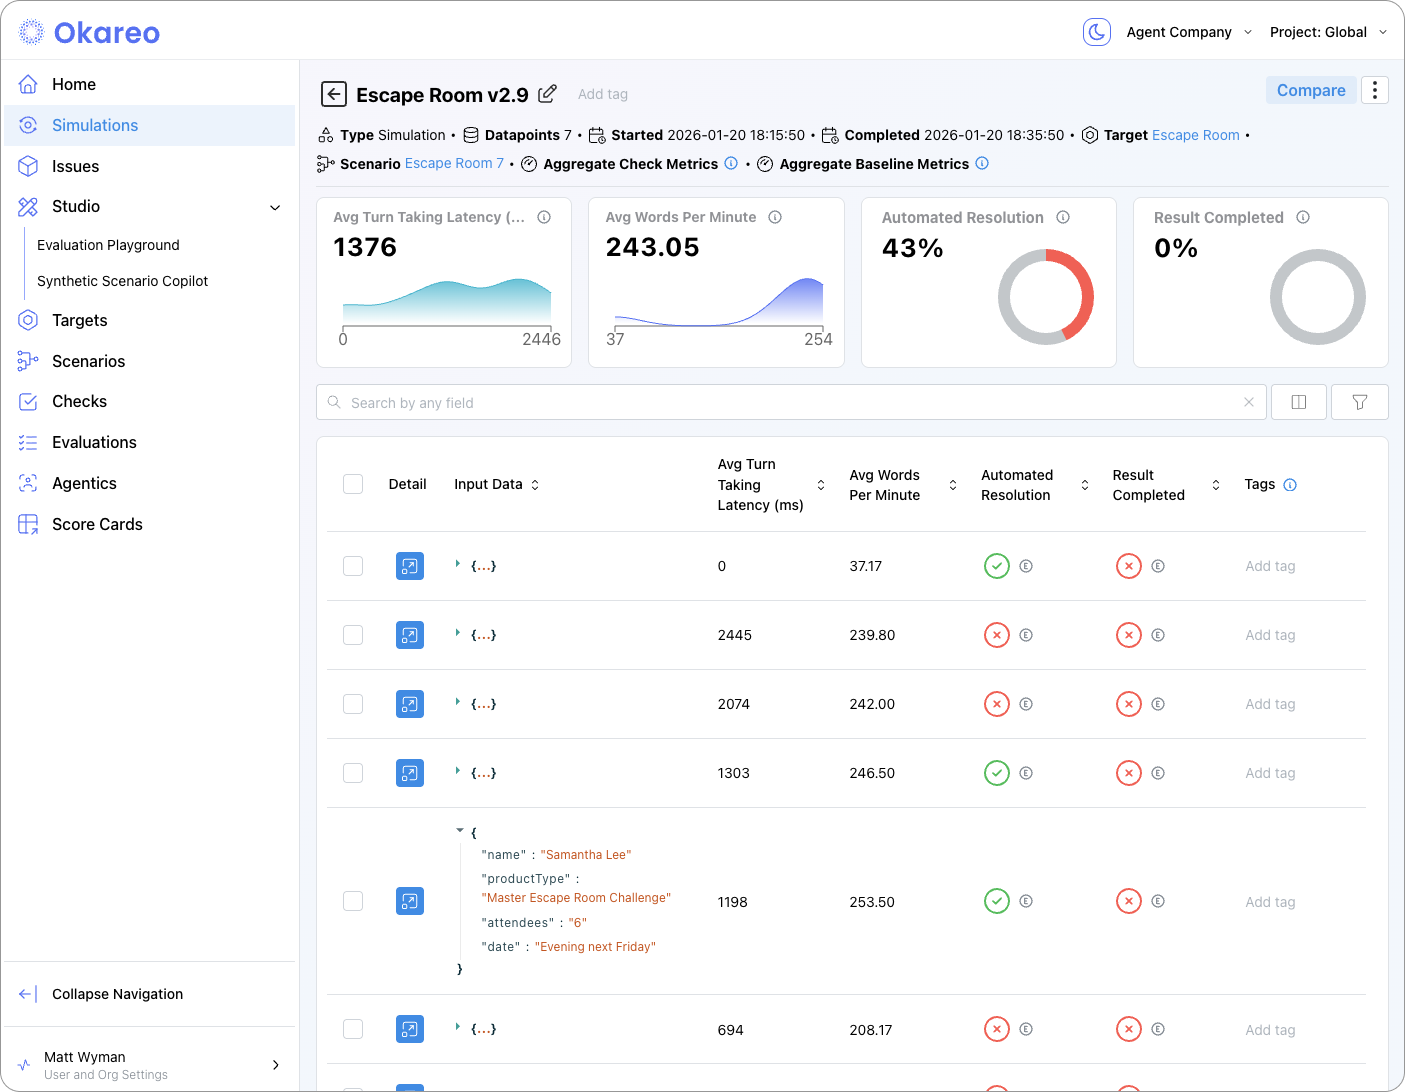
Evaluation and Simulation Runs
When you run an evaluation (e.g. generation, classification, retrieval) or a simulation (multi-turn or voice), Okareo creates a run that you can open from the relevant section (e.g. Test Runs, Simulations). From a run you can see:
- Summary — Which scenario set, model/target, and checks were used; overall pass/fail or aggregate scores.
- Per-row or per-turn results — Each scenario row or conversation turn with the check outcomes and, where applicable, the model output.
- Comparison — When you have multiple runs (e.g. before/after a prompt change), you can compare metrics and spot regressions.
Dashboards and Trends
Depending on your project, you may see:
- Run history — A list or timeline of runs for a given model or scenario set, so you can track stability over time.
- Aggregate metrics — Rollups of check pass rates or custom metrics across runs, useful for dashboards or reporting.
Use these to answer questions like: “Did the last deployment improve or worsen our scope-compliance check?” or “How many issues did we get in the last 24 hours?”
Next Steps
- Observability Overview — How monitoring and reports fit together.
- Notifications — Route issues to Slack or email so you don’t have to poll the dashboard.